The inconvenient history of Liberal Fascism
Based purely on its title, Liberal Fascism: The secret history of the Left from Mussolini to the Politics of Meaning by Jonah Goldberg, published in 2007, is not a book that I would usually consider buying.
The book traces the promotion and application of fascistic ideas by activists and politicians, from their creation by Mussolini in the 1920s to the start of this century. After these ideas first gained political prominence in the 1920s/30s as Fascism, they and the term Fascism became political opposites, i.e., one was adopted by the left and the other labelled as right-wing by the left.
The book starts by showing the extreme divergence of opinions on the definition of Fascism. The author’s solution to deciding whether policies/proposals are Fascist to compare their primary objectives and methods against those present (during the 1920s and early 1930s) in the policies originally espoused by Benito Mussolini (president of Italy from 1922 to 1943), Woodrow Wilson (the 28th US president between 1913-1921), and Adolf Hitler (Chancellor of Germany 1933-1945).
Whatever their personal opinions and later differences, in the early years of Fascism Mussolini, Wilson and Hitler made glowing public statements about each other’s views, policies and achievements. I had previously read about this love-in, and the book discusses the background along with some citations to the original sources.
Like many, I had bought into the Mussolini was a buffoon narrative. In fact, he was extremely well-read, translated French and German socialist and philosophical literature, and was considered to be the smartest of the three (but an inept wartime leader). He was acknowledged as the father of Fascism. The Italian fascists did not claim that Nazism was an offshoot of Italian fascism, and went to great lengths to distance themselves from Nazi anti-Semitism.
At the start of 1920 Hitler joined the National Socialist party, membership number 555. There is a great description of Hitler: “… this antisocial, autodidactic misanthrope and the consummate party man. He has all the gifts a cultist revolutionary party needed: oratory, propaganda, an eye for intrigue, and an unerring instinct for populist demagoguery.”
Woodrow Wilson believed that the country would be better off with the state (i.e., the government) dictating how things should be, and was willing for the government to silence dissent. The author describes the 1917 Espionage Act and the Sedition Act as worse than McCarthyism. As a casual reader, I’m not going to check the cited sources to decide whether the author is correct and that the Wikipedia articles are whitewashing history (he does not claim this), or that the author is overselling his case.
Readers might have wondered why a political party whose name contained the word ‘socialist’ came to be labelled as right-wing. The National Socialist party that Hitler joined was a left-wing party, i.e., it had the usual set of left-wing policies and appealed to the left’s social base.
The big difference, as perceived by those involved, between National Socialism and Communism, as I understand it, is that communists seek international socialism and define all nationalist movements, socialist or not, as right-wing. Stalin ordered that the term ‘socialism’ should not be used when describing any non-communist party.
Woodrow Wilson died in 1924, and Franklin D. Roosevelt (FDR) became the 32nd US president, between 1933 and 1945. The great depression happens and there is a second world war, and the government becomes even more involved in the lives of its citizens, i.e., Mussolini Fascist policies are enacted, known as the New Deal.
History repeats itself in the 1960s, i.e., Mussolini Fascist policies implemented, but called something else. Then we arrive in the 1990s and, yes, yet again Mussolini Fascist policies being promoted (and sometimes implemented) under another name.
I found the book readable and enjoyed the historical sketches. It was an interesting delve into the extent to which history is rewritten to remove inconvenient truths associated with ideas promoted by political movements.
A safety-critical certification of the Linux kernel
This week there was an announcement on the system-safety mailing list that the Red Hat In-Vehicle Operating System (a version of the Linux kernel, plus a few subsystems) had been certified as being “… capable for use in ASIL B applications, …”. The Automotive Safety Integrity Levels (ASIL A is the lowest level, with D the highest; an example of ASIL B is controlling brake lights) are defined by ISO 26262, an international standard for functional safety of electrical and/or electronic systems installed in production road vehicles.
Given all I had heard about the problems that needed to be solved to get a safety certification for something as large and complicated as the Linux kernel, I wanted to know more about how Red Hat had achieved this certification.
The traditional, idealised, approach to certifying software is to check that all requirements are documented and traceable to the design, source code, tests, and test results. This information can be used to ensure that every requirement is implemented and produces the intended behavior, and that no undocumented functionality has been implemented.
When this approach is not practical (because of onerous time/cost), a potential get out of jail card is to use a Rigorous Development Process. Certification friendly development processes appear to revolve around lots of bureaucracy and following established buzzword techniques. The only development processes that have sometimes produced very reliable software all involve spending lots of time/money.
The major problems with certifying Linux are the apparent lack of specification/requirements documents, and a development process that does not claim to be rigorous.
The Red Hat approach is to treat the Linux man pages as the specification, extract the requirements from these pages, and then write the appropriate tests. Traceability looks like it is currently on the to-do list.
I have spent a lot of time working to understand specifications and their requirements; first with the C Standard and then with the Microsoft Server Protocols. This is the first time I have encountered man pages being used in a formal setting (sometimes they are used as one of the inputs to a reimplementation of a library).
Very little Open source software has a written specification in the traditional sense of a document cited in a contract that the vendor agrees to implement. Manuals, READMEs and help pages are not written in the formal style of a specification. A common refrain is that the source code is the specification. However, source is a specification of what the program does, it is not a specification of what the program is supposed to do.
The very nature of the Agile development process demands that there not be a complete specification. It’s possible that user stories could be treated as requirements.
There is an ISO Standard with Linux in its title: the Linux Base Standard. The goal of this Standard “… is to develop and promote a set of open standards that will increase compatibility among Linux distributions and enable software applications to run on any compliant system …”, i.e., it is not a specification of an OS kernel.
POSIX is a specification of the behavior of an OS (kernel functionality is specified by POSIX.1, .2 is shell and utilities, plus other .x documents). It’s many years since I tracked POSIX/Linux compliance, which was best described as “highly compatible”. Both Grok3 and ChatGPT o4 agree that “highly compatible” is still true, and list some known incompatibilities.
While they are not written in the form of a specification, the Linux man pages do have a consistent structure and are intended to be up-to-date. A person with a background of working with Linux kernels could probably extract meaningful requirements.
How many requirements are needed to cover the behavior of the Linux kernel?
On my computer running a 6.8.0-51 kernel, the /usr/include/linux directory contains 587 header files. Based on an analysis from 20 years ago (table 1897.1), most of these headers only declare macros and types (e.g., memory layout), not function declarations. The total number of function declarations in these headers is probably in the low thousands. POSIX (2008 version) defines 1,177 functions, but the number of system calls is probably around 300-400. Android implements 821 of these functions, of which 343 are system call related.
Let’s assume 2,000 functions. Some of these functions have an argument that specifies one or more optional values, each specifying a different sub-behavior. How many different sub-behaviors are there? If we assume that each kind of behavior is specified using a C macro, then Table 1897.1 suggests there might be around 10k C macros defined in these headers.
With positive/negative tests for each case, in round numbers we get (ignoring explicit testing of the values of struct members): *2 = 24,000") test files.
test files.
This calculation does not take into account combinations of options. I’m assuming that each test file will loop through various combinations of its kind of sub-behavior.
The 1990 C compiler validation suite contained around 1k tests. Thirty-five years later, 24k test files for a large OS feels low, but then combination testing should multiply the number of actual tests by at least an order of magnitude.
What is this hand-wavy analysis missing?
I suspect that the kernel is built with most of the optional functionality conditionally compiled out. This could significantly reduce the number of api functions and the supported options.
I have not taken into account any testing of the user-visible kernel data structures (because I don’t have any occurrence data).
Comments from readers with experience in testing OSes most welcome.
Another source of Linux specific information is the Linux Kernel documentation project. I don’t have any experience using this documentation, but the API documentation is very minimalist (automatically extracted from the source; the Assessment report lists this document as [D124], but never references it in the text).
Readers familiar with safety standards will be asking about the context in which this certification applies. Safety functions are not generic; they are specific to a safety-related system, i.e., software+hardware. This particular certification is for a Safety Element out of Context (SEooC), where “out of context” here means without the context of a system or knowledge of the safety goals. SEooC supports a bottom up approach to safety development, i.e., Safety Elements can be combined, along with the appropriate analysis and testing, to create a safety-related system.
This certification is the first of what I think will be many certifications of Linux, some at more rigorous safety levels.
Software_Engineering_Practices = Morals+Theology
Including the word science in the term used to describe a research field creates an aura of scientific enterprise. Universities name departments “Computer Science” and creationist have adopted the term “Creation Science”. The word engineering is used when an aura with a practical hue is desired, e.g., “Software Engineering” and “Consciousness Engineering”.
Science and engineering theories/models are founded on the principle of reproducibility. A theory/model achieves its power by making predictions that are close enough to reality.
Computing/software is an amalgam of many fields, some of which do tick the boxes associated with science and/or engineering practices, e.g., the study of algorithms or designing hardware. Activities whose output is primarily derived from human activity (e.g., writing software) are bedevilled by the large performance variability of people. Software engineering is unlikely to ever become a real engineering discipline.
If the activity known as software engineering is not engineering, then what is it?
To me, software engineering appears to be a form of moral theology. My use of this term is derived from the 1988 paper Social Science as Moral Theology by Neil Postman.
Summarising the term moral theology via its two components, i.e., morality+theology, we have:
Morality is a system of rules that enable people to live and work together for mutual benefit. Social groups operate better when its members cooperate with each other based on established moral rules. A group operating with endemic within group lying and cheating is unlikely to survive for very long. People cannot always act selfishly, some level of altruism towards group members is needed to enable a group to flourish.
Development teams will perform better when its members cooperate with each other, as opposed to ignoring or mistreating each other. Failure to successfully work together increases the likelihood that the project the team are working on will failure; however, it is not life or death for those involved.
The requirements of group living, which are similar everywhere, produced similar moral systems around the world.
The requirements of team software development are similar everywhere, and there does appear to be a lot of similarity across recommended practices for team interaction (although I have not studied this is detail and don’t have much data).
Theology is the study of religious beliefs and practices, some of which do not include a god, e.g., Nontheism, Humanism, and Religious Naturalism.
Religious beliefs provide a means for people to make sense of their world, to infer reasons and intentions behind physical events. For instance, why it rains or doesn’t rain, or why there was plenty of animal prey during last week’s hunt but none today. These beliefs also fulfil various psychological and emotional wants or needs. The questions may have been similar in different places, but the answers were essentially invented, and so different societies have ended up with different gods and theologies.
Different religions do have some features in common, such as:
- Creation myths. In software companies, employees tell stories about the beliefs that caused the founders to create the company, and users of a programming language tell stories about the beliefs and aims of the language designer and the early travails of the language implementation.
- Imagined futures, e.g., we all go to heaven/hell: An imagined future of software developers is that source code is likely to be read by other developers, and code lives a long time. In reality, most source code has a brief and lonely existence.
A moral rule sometimes migrates to become a religious rule, which can slow the evolution of the rule when circumstances change. For instance, dietary restrictions (e.g., must not eat pork) are an adaptation to living in some environments.
In software development, the morals of an Agile methodology perfectly fitted the needs of the early Internet, where existing ways of doing things did not exist and nobody knew what customers really wanted. The signatories of the Agile manifesto now have their opinions treated like those of a prophet (these 17 prophets are now preaching various creeds).
Agile is not always the best methodology to use, with a Waterfall methodology being a better match for some environments.
Now that the Agile methodology has migrated to become a ‘religious’ dogma, the reaction to suggestions that an alternative methodology be used are often what one would expect to questioning a religious belief.
For me this is an evolving idea.
Long term growth of programming language use
The names of files containing source code often include a suffix denoting the programming language used, e.g., .c for C source code. These suffixes provide a cheap and cheerful method for estimating programming language use within a file system directory.
This method has its flaws, with two main factors introducing uncertainty into the results:
- The suffix denoting something other than the designated programming language.
- Developer choice of suffix can change over time and across development environments, e.g., widely used Fortran suffixes include
.f,.for,.ftn, and .f77(Fortran77 was the second revision of the ANSI, and the version I used intensely for several years; ChatGPT only lists later versions, i.e.,f90,f95, etc).
The paper: 50 Years of Programming Language Evolution through the Software Heritage looking glass by A. Desmazières, R. Di Cosmo, and V. Lorentz uses filename suffixes to track the use of programming languages over time. The suffix data comes from the Software Heritage, which aims to collect, and share all publicly available source code, and it currently hosts over 20 billion unique source files.
The authors extract and count all filename suffixes from the Software Heritage archive, obtaining 2,836,119 unique suffixes. GitHub’s linguist catalogue of file extensions was used to identify programming languages. The top 10 most used programming languages, since 2000, are found and various quantities plotted.
A 1976 report found that at least 450 programming languages were in use at the US Department of Defense, and as of 2020 close to 9,000 languages are listed on hopl.info. The linguist catalogue contains information on 512 programming languages, with a strong bias towards languages to write open source. It is missing entries for Cobol and Ada, and its Fortran suffix list does not include .for, .ftn and .f77.
The following analysis takes an all encompassing approach. All suffixes containing at up to three characters, the first of which is alphabetic, and occurring at least 1,000 times in any year, are initially assumed to denote a programming language; the suffixes .html, .java and .json are special cased (4,050 suffixes). This initial list is filtered to remove known binary file formats, e.g., .zip and .jar. The common file extensions listed on FileInfo were filtered using the algorithm applied to the Software Heritage suffixes, producing 3,990 suffixes (the .ftn suffix, and a few others, were manually spotted and removed). Removing binary suffixes reduced the number of assumed language suffixes from 4,050 (15,658,087,071 files) to 2,242 (9,761,794,979 files).
This approach is overly generous, and includes suffixes that have not been used to denote programming language source code.
The plot below shows the number of assumed source code files created in each year (only 50% of files have a creation date), with a fitted regression line showing a 31% annual growth in files over 52 years (code+data):
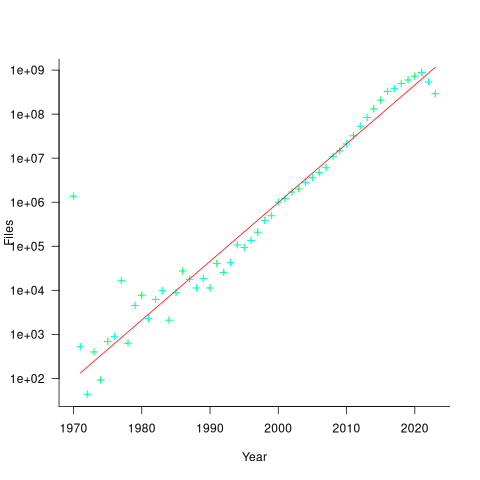
Some of the apparent growth is actually the result of older source being more likely to be lost.
Unix timestamps start on 1 Jan 1970. Most of the 1,411,277 files with a 1970 creation date probably acquired this date because of a broken conversion between version control systems.
The plot below shows the number of files assumed to contain source code in a given language per year, with some suffixes used before the language was invented (its starts in 1979, when total file counts stat always being over 1,000; code+data):
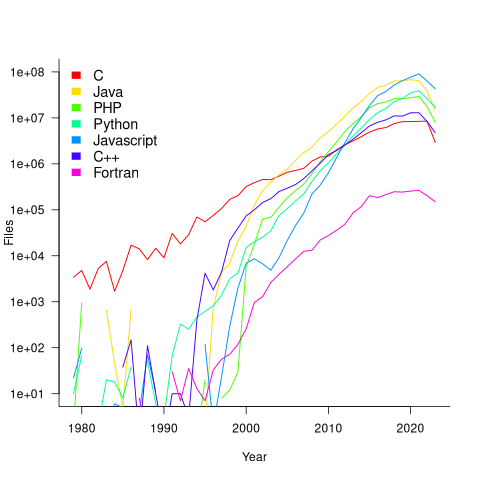
Over the last few years, survey results have been interpreted as showing declining use of C. This plot suggests that use of C is continuing to grow at around historical rates, but that use of other languages has grown rapidly to claim a greater percentage of developer implementation effort.
The major issue with this plot is what is not there. Where is the Cobol, once the most widely used language? Did Fortran only start to be used during the 1990s? Millions of lines of Cobol and Fortran were written between 1960 and 1985, but very little of this code is publicly available.
Deciding whether a conclusion is possible or necessary
Psychologists studying human reasoning have primarily focused on syllogistic reasoning, i.e., the truthfulness of a necessary conclusion from two stated premises, as in the following famous example:
    All men are mortal.
    Socrates is a man.
Therefore, Socrates is mortal. |
Another form of reasoning is modal reasoning, which deals with possibilities and necessities; for example:
    All programmers like jelly beans,
    Tom likes jelly beans,
Therefore, it is possible Tom is a programmer. |
Possibilities and necessities are fundamental to creating software. I would argue (without evidence) that possibility situations occur much more frequently during software development than necessarily situations.
What is the coding impact of incorrect Possible/Necessary decisions (the believability of a syllogism has been found to influence subject performance)?
- Conclusion treated as possible, while being necessary: A possibility involves two states, while necessity is a single state. A possible condition implies coding an
if/else(or perhaps one arm of anif), while a necessary condition is at most one arm of anif(or perhaps nothing).The likely end result of making this incorrect decision is some dead code.
- Conclusion treated as necessary, while being possible: Here two states are considered to be a single state.
The likely end result of making this incorrect decision is incorrect code.
What have the psychology studies found?
The 1999 paper: Reasoning About Necessity and Possibility: A Test of the Mental Model Theory of Deduction by J. St. B. T. Evans, S. J. Handley, C. N. J. Harper, and P. N. Johnson-Laird, experimentally studied three predictions (slightly edited for readability):
- People are more willing to endorse conclusions as Possible than as Necessary.
- It is easier to decide that a conclusion is Possible if it is also Necessary. Specifically, we predict more endorsements of Possible for Necessary than for Possible problems.
- It is easier to decide that a conclusion is not Necessary if it is also not Possible. Specifically, we predict that more Possible than Impossible problems will be endorsed as Necessary.
Less effort is required to decide that a conclusion is Possible because just one case needs to be found, while making a Necessary decision requires evaluating all cases.
In one experiment, subjects (120 undergraduates studying psychology) saw a screen containing a question such as the following (an equal number of questions involved NECESSARY/POSSIBLE):
   GIVEN THAT
     Some A are B
   IS IT NECESSARY THAT
Some B are not A |
Subjects saw each of the 28 possible combinations of four Premises and seven Conclusions. The table below shows eight combinations of the four Premises and seven conclusions, the Logic column shows the answer (N=Necessary; I=Impossible; P=Possible), and the Necessary/Possible columns show the number of subjects answering that the conclusion was Necessary/Possible:
Premise Conclusion Logic Necessary Possible All A are B Some A are B N 65 82 All A are B No A are B I 3 12 Some A are B All A are B P 3 53 Some A are B No A are B I 8 55 No A are B Some A are not B N 77 80 No A are B No B are A I 7 25 Some A are not B All A are B I 2 3 Some A are not B Some B are A P 70 95 |
The table below shows the percentage of answer specifying that the conclusion was Necessary/Possible (2nd/3rd rows), when the Logical answer was one of Impossible/Necessary/Possible (code+data):
  Logic   I     N     P
    N     8%   59%   38%
P 19% 71% 60% |
The percentage of Possible answers is always much higher than Necessary answers (when a Conclusion is Necessary, it is also Possible), even when the Conclusion is Impossible. The 38% of Necessary answers for when the Conclusion is only Possible is somewhat concerning, as this decision could produce coding mistakes.
The paper ran a second experiment involving two premises, like the Jelly bean example, attempting to distinguish strong/weak forms of Possible.
Do these results replicate?
The 2024 study Necessity, Possibility and Likelihood in Syllogistic Reasoning by D. Brand, S. Todorovikj, and M. Ragni, replicated the results. This study also investigated the effect of using Likely, as well as Possible/Necessary. The results showed that responses for Likely suggested it was a middle ground between Possible/Necessary.
After writing the above, I asked Grok: list papers that have studied the use of syllogistic reasoning by software developers: nothing software specific. The same question for modal reasoning returned answers on the use of Modal logic, i.e., different subject. Grok did a great job of summarising the appropriate material in my Evidence-base Software Engineering book.
CPU power consumption and bit-similarity of input
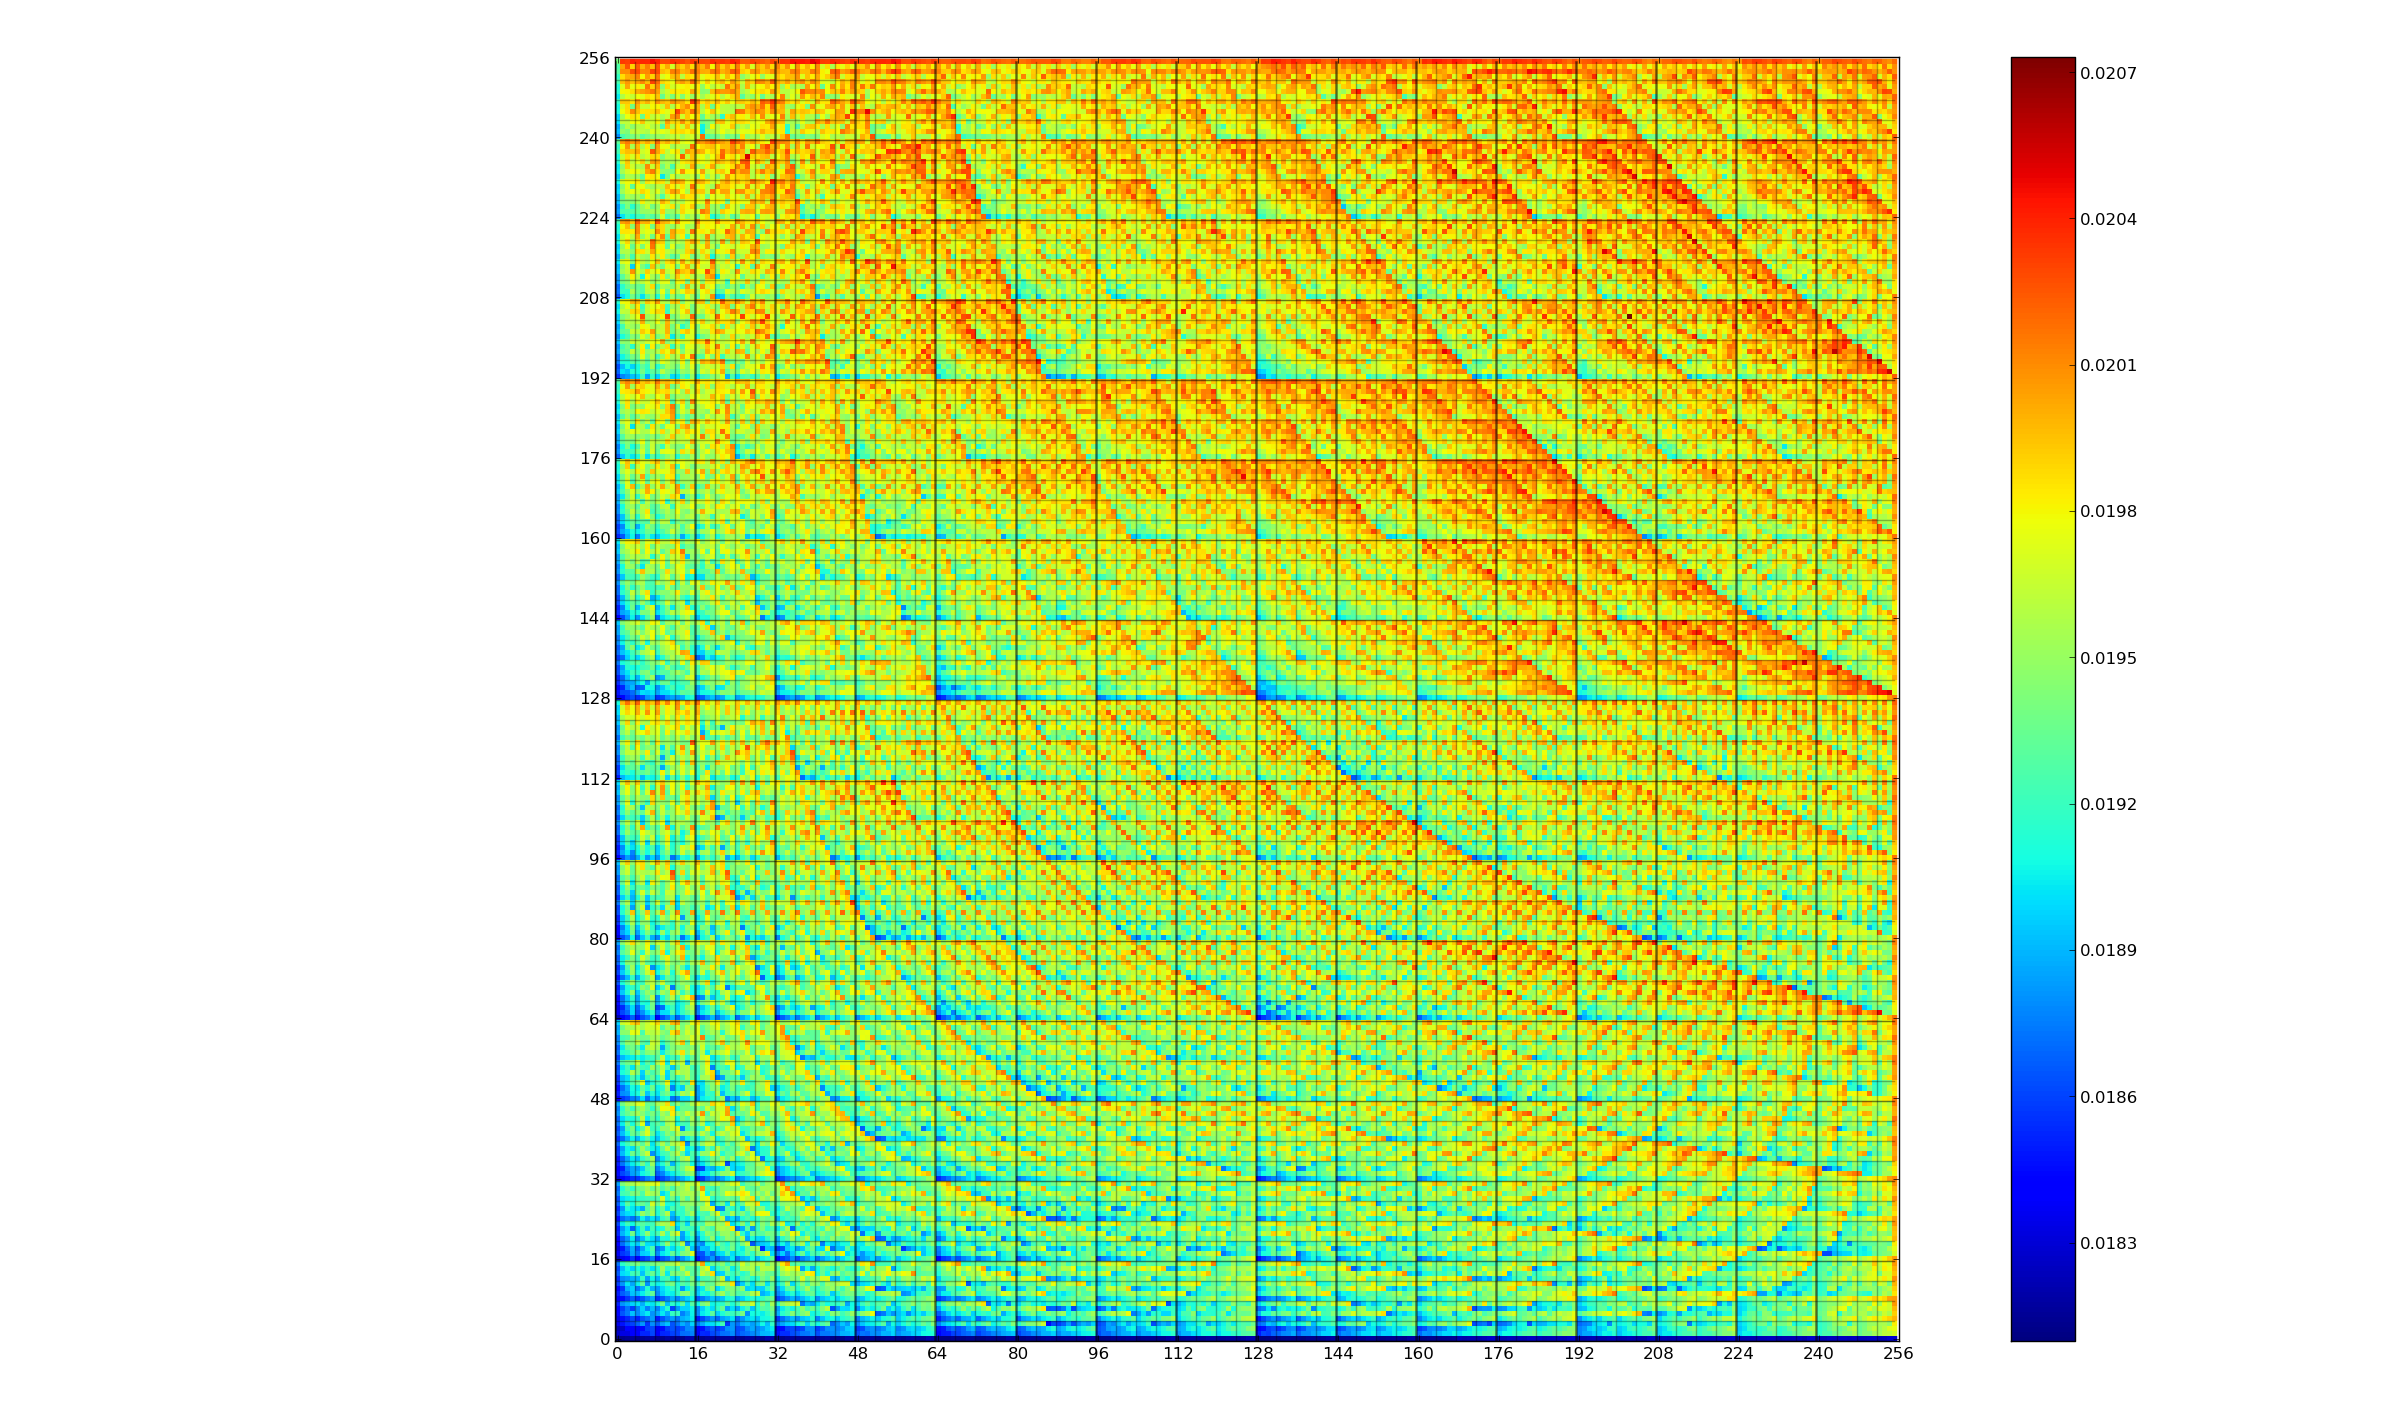
Changing the state of a digital circuit (i.e., changing its value from zero to one, or from one to zero) requires more electrical power than leaving its state unchanged. During program execution, the power consumed by each instruction depends on the value of its operand(s). The plot below, from an earlier post, shows how the power consumed by an 8-bit multiply instruction varies with the values of its two operands:
An increase in cpu power consumption produces an increase in its temperature. If the temperature gets too high, the cpu’s DVFS (dynamic voltage and frequency scaling) will slow down the processor to prevent it overheating.
When a calculation involves a huge number of values (e.g., an LLM size matrix multiply), how large an impact is variability of input values likely to have on the power consumed?
The 2022 paper: Understanding the Impact of Input Entropy on FPU, CPU, and GPU Power by S. Bhalachandra, B. Austin, S. Williams, and N. J. Wright, compared matrix multiple power consumption when all elements of the matrices had the same values (i.e., minimum entropy) and when all elements had different random values (i.e., maximum entropy).
The plot below shows the power consumed by an NVIDIA A100 Ampere GPU while multiplying two 16,384 by 16,384 matrices (performed 100 times). The GPU was power limited to 400W, so the random value performance was lower at 18.6 TFLOP/s, against 19.4 TFLOP/s for same values; (I don’t know why the startup times differ; code+data):
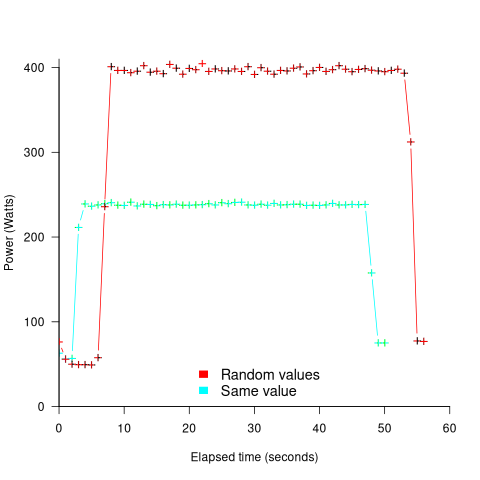
This 67% performance difference is more than an interesting factoid. Large computations are distributed over multiple GPUs, and the output from each GPU is sometimes feed as input to other GPUs. The flow of computations around a cluster of GPUs needs to be synchronised, and having compute time depend on the distribution of the input values makes life complicated.
Is it possible to organise a sequence of calculation to reduce the average power consumed?
The higher order bits of small integers are zero, but how many long calculations involve small integers? The bit pattern of floating-point values are more difficult to predict, but I’m sure there is a PhD thesis or two waiting to be written around this issue.
Procedure nesting a once common idiom
Structured programming was a popular program design methodology that many developers/managers claimed to be using in the 1970s and 1980s. Like all popular methodologies, everybody had/has their own idea about what it involves, and as always, consultancies sprang up to promote their take on things. The 1972 book Structured programming provides a taste of the times.
The idea underpinning structured programming is that it’s possible to map real world problems to some hierarchical structure, such as in the image below. This hierarchy model also provided a comforting metaphor for those seeking to understand software and its development.

The disadvantages of the Structured programming approach (i.e., real world problems often have important connections that cannot be implemented using a hierarchy) become very apparent as programs get larger. However, in the 1970s the installed memory capacity of most computers was measured in kilobytes, and a program containing 25K lines of code was considered large (because it was enough to consume a large percentage of the memory available). A major program usually involved running multiple, smaller, programs in sequence, each reading the output from the previous program. It was not until the mid-1980s…
At the coding level, doing structured programming involves laying out source code to give it a visible structure. Code blocks are indented to show if/for/while nesting and where possible procedure/functions are nested within the calling procedures (before C became widespread, functions that did not return a value were called procedures; Fortran has always called them subroutines).
Extensive nesting of procedures/functions was once very common, at least in languages that supported it, e.g., Algol 60 and Pascal, but not Fortran or Cobol. The spread of C, and then C++ and later Java, which did not support nesting (supported by gcc as an extension, nested classes are available in C++/Java, and later via lambda functions), erased nesting from coding consideration. I started life coding mostly in Fortran, moved to Pascal and made extensive use of nesting, then had to use C and not being able to nest functions took some getting used to. Even when using languages that support nesting (e.g., Python), I have not reestablished by previous habit of using nesting.
A common rationale for not supporting nested functions/methods is that it complicate the language specification and its implementation. A rather self-centered language designer point of view.
The following Pascal example illustrates a benefit of being able to nest procedures/functions:
procedure p1; var db :array[db_size] of char; procedure p2(offset :integer); function p3 :integer; begin (* ... *) return db[offset]; end; begin var off_val :char; off_val=p3; (* ... *) end; begin (* ... *) p2(3) end; |
The benefit of using nesting is in not forcing the developer to have to either define db at global scope, or pass it as an argument along the call chain. Nesting procedures is also a method of information hiding, a topic that took off in the 1970s.
To what extent did Algol/Pascal developers use nested procedures? A 1979 report by G. Benyon-Tinker and M. M. Lehman contains the only data I am aware of. The authors analysed the evolution of procedure usage within a banking application, from 1973 to 1978. The Algol 60 source grew from 35,845 to 63,843 LOC (657 procedures to 967 procedures). A large application for the time, but a small dataset by today’s standards.
The plot below shows the number of procedures/functions having a particular lexical nesting level, with nesting level 1 is the outermost level (i.e., globally visible procedures), and distinct colors denoting successive releases (code+data):

Just over 78% of procedures are nested within at least one other procedure. It’s tempting to think that nesting has a Poisson distribution, however, the distribution peaks at three rather than two. Perhaps it’s possible to fit an over-dispersed, but this feels like creating a just-so story.
What is the distribution of nested functions/methods in more recently written source? A study of 35 Python projects found 6.5% of functions nested and over twice as many (14.2%) of classed nested.
Are there worthwhile benefits to using nested functions/methods where possible, or is this once common usage mostly fashion driven with occasional benefits?
Like most questions involving cost/benefit analysis of language usage, it’s probably not sufficiently interesting for somebody to invest the effort required to run a reliable study.
Functions reduce the need to remember lots of variables
What, if any, are the benefits of adding bureaucracy to a program by organizing a file’s source code into multiple function/method definitions (rather than a single function)?
Having a single copy of a sequence of statements that need to be executed at multiple points in a program reduces implementation effort, and any updates only need to be made once (reducing coding mistakes by removing the need to correctly make duplicate changes). A function/method is the container for this sequence of statements.
Why break code up into separate functions when each is only called once and only likely to ever be called once?
The benefits claimed from splitting code into functions include: making it easier to understand, test, debug, maintain, reuse, and scale development (i.e., multiple developers working on the same program). Our LLM overlords also make these claims, and hallucinate references to published evidence (after three iterations of pointing out the hallucinated references, I gave up asking for evidence; my experience with asking people is that they usually remember once reading something but cannot remember the source).
Regular readers will not be surprised to learn that there is little or no evidence for any of the claimed benefits. I’m not saying that the benefits don’t exist (I think there are some), simply that there have not been any reliable studies attempting to measure the benefits (pointers to such studies welcome).
Having decided to cluster source code into functions, for whatever reason, are there any organizational rules of thumb worth following?
Rules of thumb commonly involve function length (it’s easy to measure) and desirable semantic characteristics of distinct functions (it’s very hard to measure semantic characteristics).
Claims for there being an optimal function length (i.e., lines of code that minimises coding mistakes) turned out to be driven by a mathematical artifact of the axis used when plotting (miniscule) datasets.
Semantic rules of thumb such as: group by purpose, do one thing, and Single-responsibility principle are open to multiple interpretations that often boil down to personal preferences and experience.
One benefit of using functions that is rarely studied is the restricted visibility of local variables defined within them, i.e., only visible within the function body.
When trying to figure out what code does, readers have to keep track of the information contained in all the variables accessed. Having to track more variables not only increases demands on reader memory, it also increases the opportunities for making mistakes.
A study of C source found that within a function, the number of local variables is proportional to the square root of the number of statements (code+data). Assuming the proportionality constant is one, a function containing 100 statements might be expected to define 10 local variables. Splitting this function up into, say, four functions containing 25 statements, each is expected to define 5 local variables. The number of local variables that need to be remembered at the same time, when reading a function definition, has halved, although the total number of local variables that need to be remembered when processing those 100 statements has doubled. Some number of global variables and function parameters need to be added to create an overall total for the number of variables.
The plot below shows the number of locals defined in 36,617 C functions containing a given number of statements, the red line is a fitted regression model having the form:  (code+data):
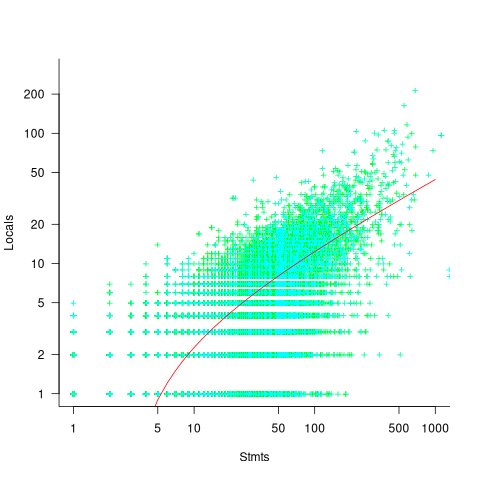
My experience with working with recently self-taught developers, especially very intelligent ones, is that they tend to write monolithic programs, i.e., everything in one function in one file. This minimal bureaucracy approach minimises the friction of a stream of thought development process for adding new code, and changing existing code as the program evolves. Most of these programs are small (i.e., at most a few hundred lines). Assuming that these people continue to code, one of two events teaches them the benefits of function bureaucracy:
- changes to older programs becomes error-prone. This happens because the developer has forgotten details they once knew, e.g., they forget which variables are in use at particular points in the code,
- the size of a program eventually exceeds their ability to remember all of it (very intelligent people can usually remember much larger programs than the rest of us). Coding mistakes occur because they forget which variables are in use at particular points in the code.
Remotivating data analysed for another purpose
The motivation for fitting a regression model has a major impact on the model created. Some of the motivations include:
- practicing software developers/managers wanting to use information from previous work to help solve a current problem,
- researchers wanting to get their work published seeks to build a regression model that show they have discovered something worthy of publication,
- recent graduates looking to apply what they have learned to some data they have acquired,
- researchers wanting to understand the processes that produced the data, e.g., the author of this blog.
The analysis in the paper: An Empirical Study on Software Test Effort Estimation for Defense Projects by E. Cibir and T. E. Ayyildiz, provides a good example of how different motivations can produce different regression models. Note: I don’t know and have not been in contact with the authors of this paper.
I often remotivate data from a research paper. Most of the data in my Evidence-based Software Engineering book is remotivated. What a remotivation often lacks is access to the original developers/managers (this is often also true for the authors of the original paper). A complicated looking situation is often simplified by background knowledge that never got written down.
The following table shows the data appearing in the paper, which came from 15 projects implemented by a defense industry company certified at CMMI Level-3.
Proj  Test    Req   Test Meetings Faulty    Actual Scenarios
      Plan    Rev   Env          Scenarios  Effort
      Time          Time
P1    144.5  1.006    85     60     100      2850    270
P2     25.5  1.001    25.5    4       5       250     40
P3     68    1.005    42.5   32      65      1966    185
P4     85    1.002    85    104     150      3750    195
P5    198    1.007   123     87     110      3854    410
P6     57    1.006    35     25      20       903    100
P7    115    1.003    92     55      56      2143    225
P8     81    1.009   156     62      72      1988    287
P9    388    1.004   150    208     553     13246   1153
P10   177    1.008    93     77     157      4012    360
P11    62    1.001   175    186     199      5017    310
P12   111    1.005   116     82     143      3994    423
P13    63    1.009   188    177     151      3914    226
P14    32    1.008    25     28       6       435     63
P15 167 1.001 177 143 510 11555 1133 |
where: TestPlanTime is the test plan creation time in hours, ReqRev is the test/requirements review of period in hours, TestEnvTime is the test environment creation time in hours, Meetings is the number of meetings, FaultyScenarios is the number of faulty test scenarios, Scenarios is the number of Scenarios, and ActualEffort is the actual software test effort.
Industrial data is hard to obtain, so well done to the authors for obtaining this data and making it public. The authors fitted a regression model to estimate software test effort, and the model that almost perfectly fits to actual effort is:
ActualEffort=3190 + 2.65*TestPlanTime
            -3170*ReqRevPeriod - 3.5*TestEnvTime
+10.6*Meetings + 11.6*FaultScrenarios + 3.6*Scenarios |
My reading of this model is that having obtained the data, the authors felt the need to use all of it. I have been there and done that.
Why all those multiplication factors, you ask. Isn’t ActualTime simply the sum of all the work done? Yes it is, but the above table lists the work recorded, not the work done. The good news is that the fitted regression models shows that there is a very high correlation between the work done and the work recorded.
Is there a simpler model that can be used to explain/predict actual time?
Looking at the range of values in each column, ReqRev varies by just under 1%. Fitting a model that does not include this variable, we get (a slightly less perfect fit):
ActualEffort=100  + 2.0*TestPlanTime
                              - 4.3*TestEnvTime
+10.7*Meetings + 12.4*FaultScrenarios + 3.5*Scenarios |
Simple plots can often highlight patterns present in a dataset. The plot below shows every column plotted against every other column (code+data):

Points forming a straight line indicate a strong correlation, and the points in the top-right ActualEffort/FaultScrenarios plot look straight. In fact, this one variable dominates the others, and fits a model that explains over 99% of the deviation in the data:
ActualEffort=550 + 22.5*FaultScrenarios |
Many of the points in the ActualEffort/Screnarios plot are on a line, and adding Meetings data to the model explains just under 99% of the variance in the data:
actualEffort=-529.5
+15.6*Meetings + 8.7*Scenarios |
Given that FaultScrenarios is a subset of Screnarios, this connectedness is not surprising. Does the number of meetings correlate with the number of new FaultScrenarios that are discovered? Questions like this can only be answered by the original developers/managers.
The original data/analysis was interesting enough to get a paper published. Is it of interest to practicing software developers/managers?
In a small company, those involved are likely to already know what these fitted models are telling them. In a large company, the left hand does not always know what the right hand is doing. A CMMI Level-3 certified defense company is unlikely to be small, so this analysis may be of interest to some of its developer/managers.
A usable estimation model is one that only relies on information available when the estimation is needed. The above models all rely on information that only becomes available, with any accuracy, way after the estimate is needed. As such, they are not practical prediction models.
Benchmarking string search algorithms
Searching a sequence of items for occurrences of a specific pattern is a common operation, and researchers are still discovering faster string search algorithms.
While skimming the paper Efficient Exact Online String Matching Through Linked Weak Factors by M. N. Palmer, S. Faro, and S. Scafiti, Tables 1, 2 and 3 jumped out at me. The authors put a lot of effort into benchmarking the performance of 21 search algorithms representing a selection of go-faster techniques (they wanted to show that their new algorithm, using hash chains, was the fastest; Grok explains the paper). I emailed the authors for the data, and Matt Palmer kindly added it to the HashChain Github repo. Matt was also generous with his time answering my questions.
The benchmark search involved three sequences of items, each of 100MB, a genome sequence, a protein sequence and English text. The following analysis if based on results from searching the English text. The search process returned the number of occurrences of the pattern in the character sequence.
The patterns to search for were randomly extracted from the sequence being searched. Eleven pattern lengths were used, ranging from 4 to 4,096 items in powers of 2 (the tables in the paper list lengths in the range 8 to 512). There were 500 runs for each length, with a different pattern used each time, i.e., a total of 5,500 patterns. Every search algorithm matched the same 5,500 patterns.
Some algorithms have tuneable parameters (e.g., the number of characters hashed), and 107 variants of the 21 algorithms were run, giving a total of 555,067 timing measurements (a 200ms time limit sometimes prevented a run completing).
To understand some of the patterns present in the timing results, it’s necessary to know something about how industrial strength string search algorithms work. The search pattern is first processed to create either a finite state machine or some other data structure. The matching process starts at the right of the pattern and moves left, comparing items. This approach makes it possible to skip over sequences of text that cannot match. For instance, if the current text character is X, this is fed into the finite state machine created from the pattern, and if X is not in the pattern, the matching process can move forward by the length of the pattern (if the pattern contains an X, the matching process skips forward the appropriate number of characters). This pattern shift technique was first implemented in the Boyer-Moore algorithm in 1977.
One consequence of skipping over sequences that cannot match, is that longer pattern enable longer skips, resulting in faster searches. The following plot shows the search time against pattern length for two algorithms; total time includes preprocessing the pattern and searching the text (red plus symbols have been offset by 10% to show both timings; code+data):
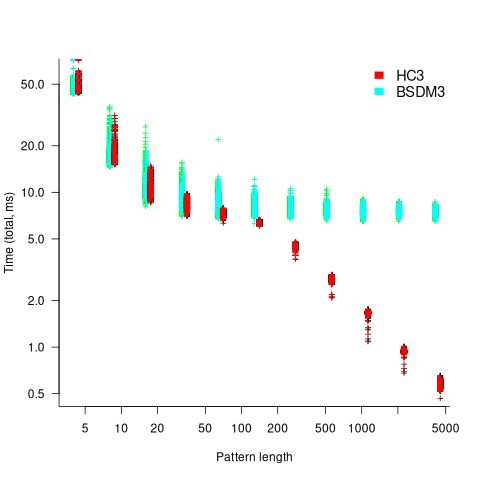
Why does the search time for HC3 (one variant of the author’s new algorithm) start to plateau and then start decreasing again? One possible cause of this saddle point is the cpu cache line width, which is 64 bytes on the system that ran the benchmarks. When the skip length is at least twice the cache line width, it is not necessary to read characters that would cause the filling of at least one cache line. As always, further research is needed.
What is the most informative method for comparing the algorithm/tool performance?
The most commonly used method is to compare mean performance times, and this is what the authors do for each pattern length. A related alternative, given that different patterns are used for each run, is to compare median times, on the basis that users are interested in the fastest algorithm across many patterns. When variance in the search times is taken into account, there is no clear winner across all pattern lengths (the uncertainty in the mean value is sometimes larger than the difference in performance).
Comparing performance across pattern lengths is interesting for algorithm designers, but users want a single performance value. The traditional approach to building a single model, that would include pattern length and algorithm, is to fit a regression model. However, this approach requires that the change in performance with pattern length roughly have the same form across all algorithms. The plot above clearly shows two algorithms with different forms of change of timing behavior with pattern length (other algorithms exhibit different behaviors).
A completely different modelling approach is to treat each pattern search as a competition between algorithms, with algorithms ranked by search time (fastest first). In this approach, the relative performance of each algorithm is ranked; there are 500 ranks for each pattern length. The fitted model can be used to calculate the probability, over all patterns, that algorithm A1 will be faster than algorithm A2.
Readers might be familiar with the Bradley-Terry model, where two items are ranked, e.g., the results from football games played between pairs of teams during a season. When more than two items are ranked, a Plackett-Luce model can be fitted. The output from fitting these models is a value,  , for each of the algorithms, e.g.,
  . The probability that algorithm
 A1 will rank higher than Algorithm A2 is calculated from the expression:
 , this expression can also be written as:
Switch A1 and A2 to calculate the opposite ranking.
The probability that algorithm A1 ranks higher than Algorithm A2 which in turn ranks higher than Algorithm A3 is calculated as follows (and so on for more algorithms):

For ease of comparison, only the 53 algorithms with 500 sets of timing data for all pattern lengths was fitted. The following plot shows the fitted values for each algorithm (blue/green lines are standard errors, and names containing HC are some variant of the authors’ hash chain technique; code+data):
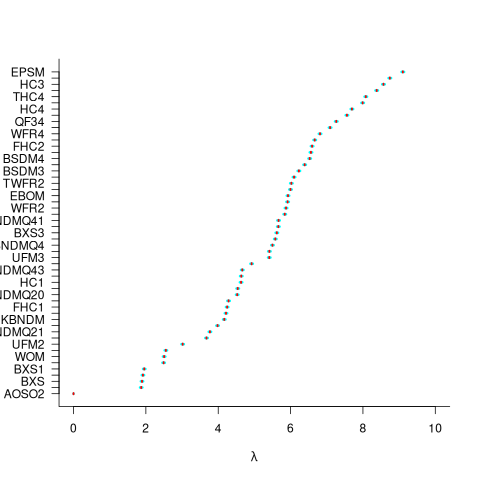
The EPSM algorithm makes use of the SSE and AVX instructions, supported by modern x86 processors, that can operate on up to 512 bits at a time.
The following table lists the fitted lambda values for the top eight ranked algorithm implementation:
 Algorithm    Lambda
      EPSM    9.103007
      THC3    8.743377
       HC3    8.567715
      FHC3    8.381220
      THC4    8.079716
      FHC4    7.991929
       HC4    7.695787
TWFR4 7.557796 |
The likelihood that EPSM will rank higher than THC3 is } right 0.59") .
.
This is better than random, and reflects the variability in algorithm performance, i.e., there is no clear winner.
It might be possible to extract more information from the data.
Some algorithms use of the same technique for part of their search process. Information on the techniques shared by algorithms can be added to the model as covariates. Assuming that a suitable fit is obtained, the model coefficients would indicate the relative impact of each technique on performance. I don’t know enough to select the techniques, and Matt is thinking about it.
Recent Comments